Open Source GitHub Analytics

Data
>
Feelings

Team alignment > Superstars

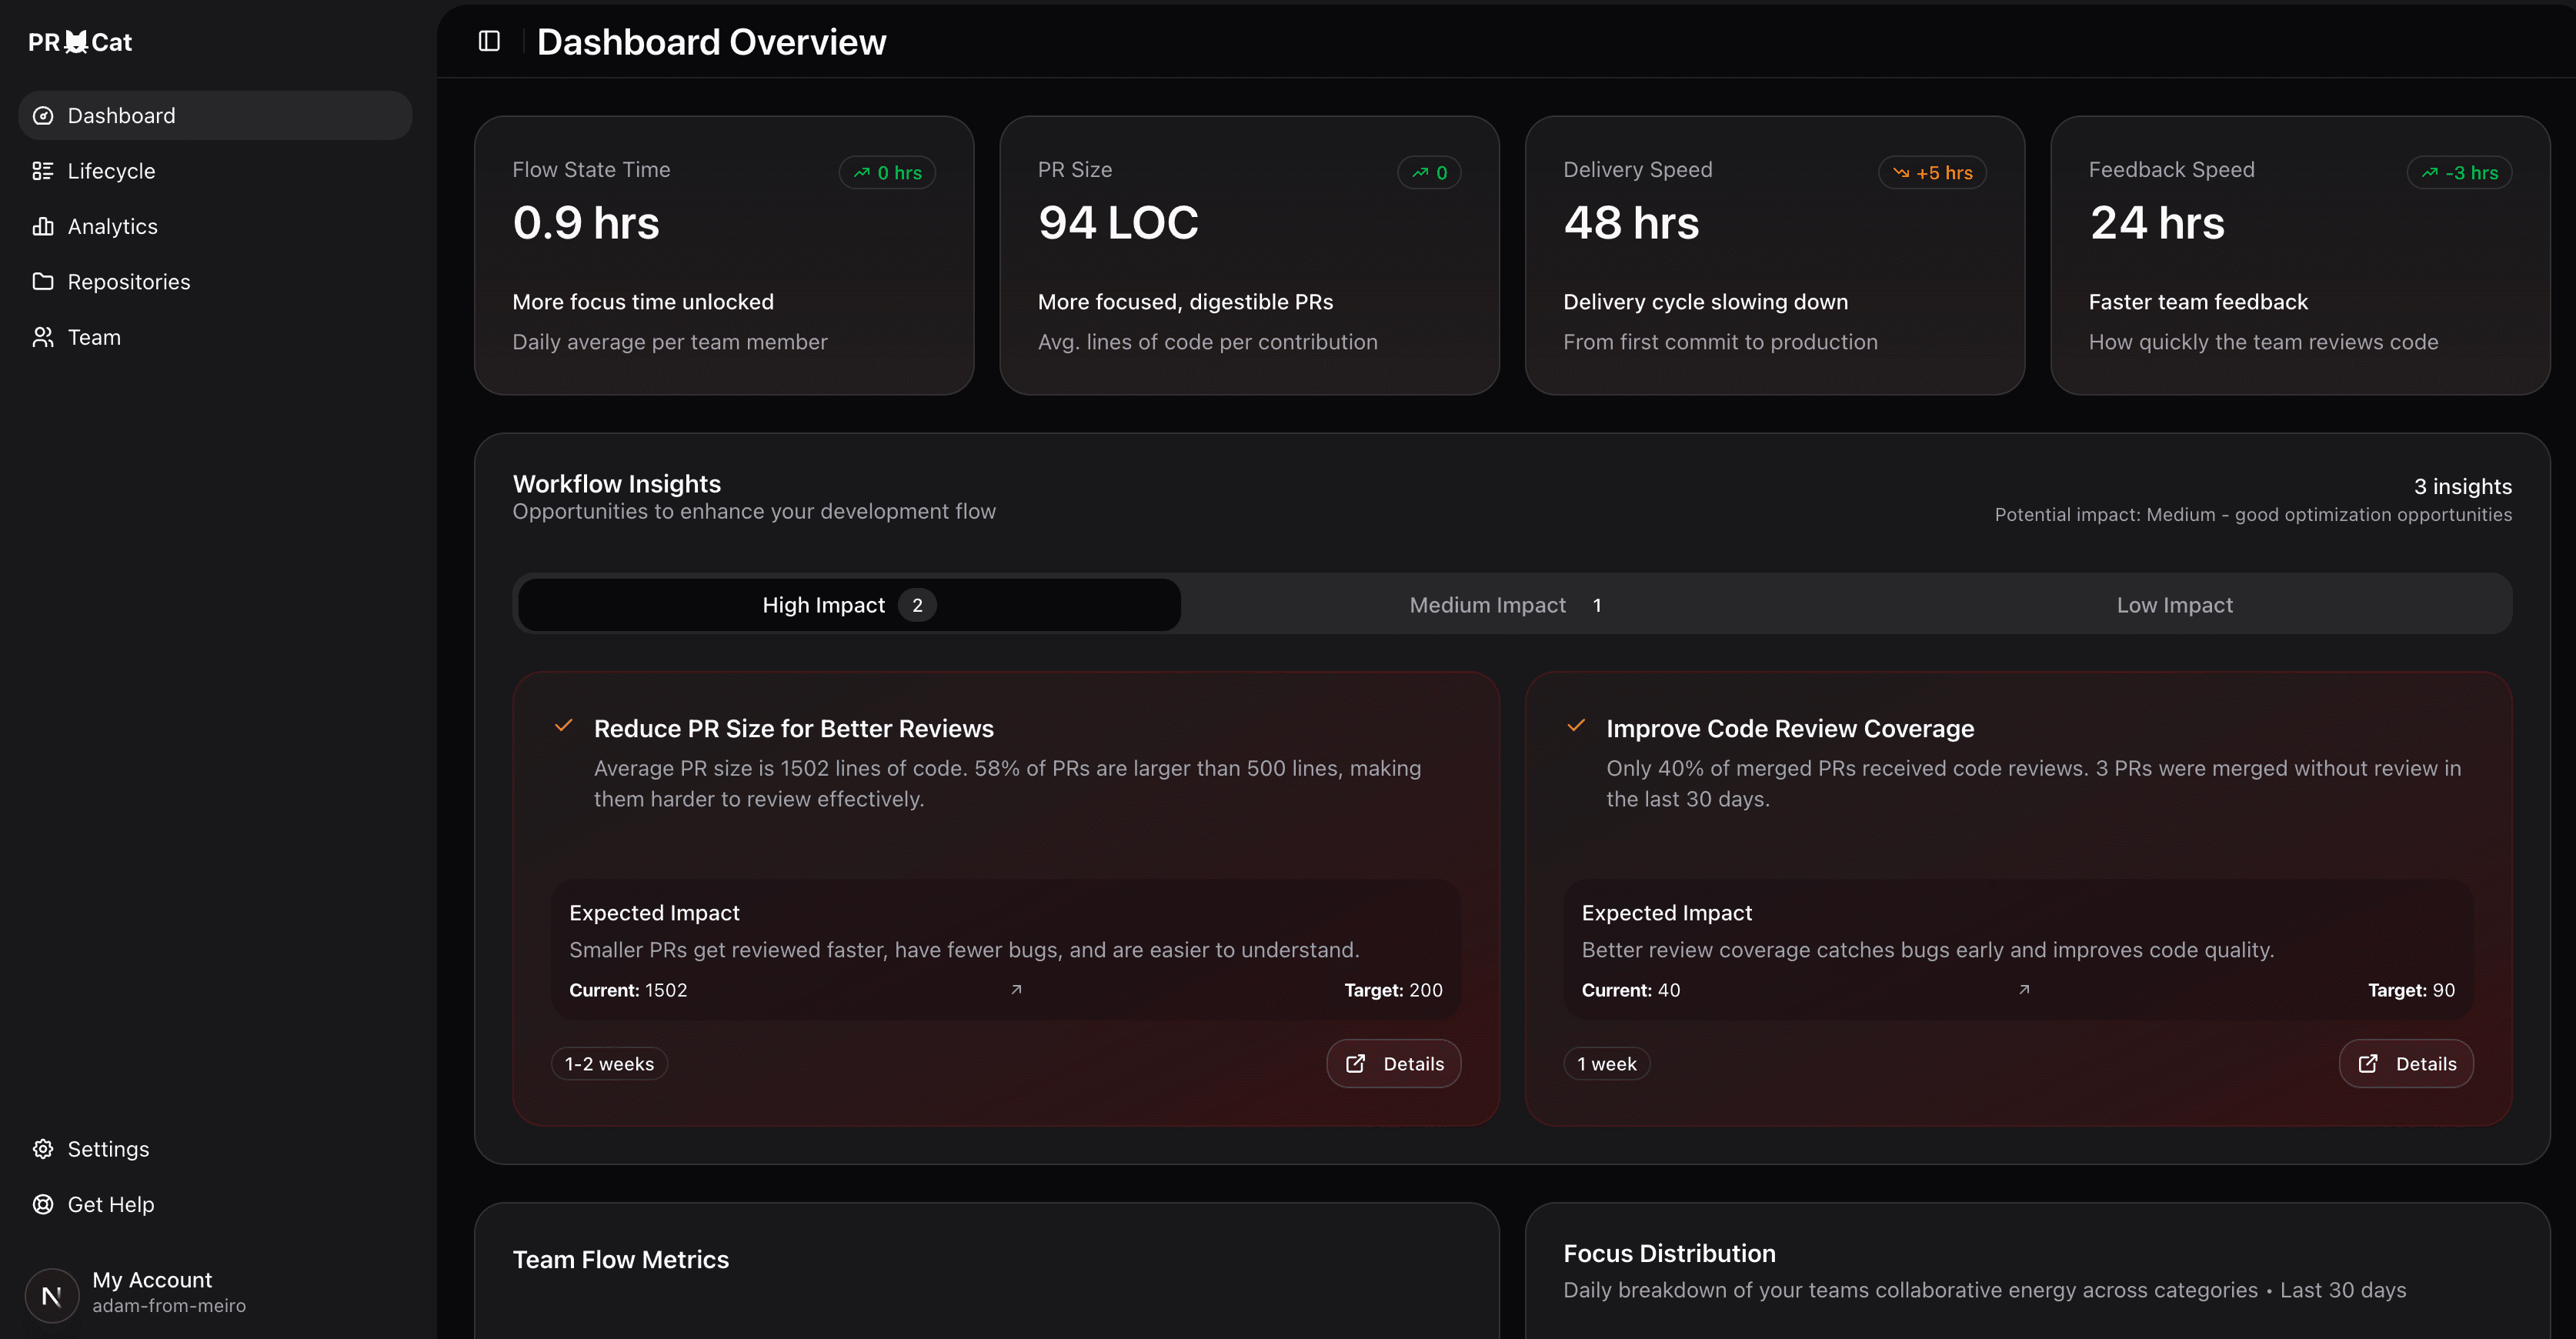
Self-hosted GitHub analytics that puts evidence-based decisions first, fostering team growth through transparency and continuous improvement.

PR Cat Dashboard Screenshot
MIT Licensed
Self-Hostable
Open Source

Why Open Source Engineering Analytics?

Because the best engineering tools are built by engineers, for engineers. Not by vendors trying to sell you a black box.

Complete Transparency

See exactly how your data is processed. No hidden algorithms, no mysterious "proprietary metrics." Every calculation is open for inspection.

Your Data, Your Infrastructure

Deploy on your own servers. Your sensitive engineering data never leaves your environment. Full control, zero vendor dependency.

Built by Engineers

Features requested by real engineering teams. No corporate roadmap driven by sales targets. Just tools that actually help developers.

With support from our friends at:

No Vendor Lock-in, Ever

Your data stays yours. Deploy anywhere, modify anything, contribute back if you want. That's the promise of truly open source software.

Turn team insights into collaborative wins

Get the concrete metrics your team needs for data-driven retrospectives, meaningful standups, and collaborative growth conversations.

Data-Driven Retrospectives

Move beyond "gut feeling" retrospectives. Use concrete metrics to identify what's working in your team's workflow, what's not, and specific actions you can take to improve together.

"Our overall cycle time increased 40% this sprint" — Is it complex features or review bottlenecks?

"Only 67% of PRs got reviewed across teams" — Should we make reviews faster, not optional?

"60% effort on bug fixes vs features this sprint" — Time to address root causes?

Sprint Retrospective Template

📈 What's improving?Review trends
🚩 What needs attention?Cycle time spikes
🎯 This week's focus?Smaller PRs

Team health metrics that matter

For developers and teams who see success as a collaborative achievement, not individual performance metrics.

Delivery Speed

Understand your team's flow from first commit to production deployment across all your repositories.

PR Size

Work together toward smaller, more digestible changes for better team flow and collaboration.

Feedback Speed

Optimize how quickly your team provides meaningful code reviews to each other.

Flow State Time

Understand how much time your team spends in a state of high productivity and collaboration.

Ready to deploy your own engineering analytics?

Join development teams that trust open source. Deploy PR Cat on your infrastructure and start gaining insights into your team's workflow.

MIT Licensed • Self-Hosted • No vendor lock-in • Full control